Red–amber–green scorecards leaders trust, and act on.
How to build red-amber-green KPI scorecards by department, review trends, and use frozen snapshots so performance reviews discuss the same numbers.
The principle
A scorecard earns trust when everyone in the room is looking at the same numbers, frozen at the same moment.
Performance reviews often start with a debate about the data. One version of the scorecard was exported on Monday, another on Wednesday, and someone corrected a figure in between. By the time the numbers are agreed, the meeting is half over.
Scorecards are meant to make performance conversations faster and sharper. When they are inconsistent, out of date or crowded with indicators nobody owns, they do the opposite. A few disciplines, consistent thresholds, clear ownership, trends and frozen snapshots, turn a scorecard into a tool leaders rely on.
01 · Start with context
Scorecards connect KPIs to decisions.
KPIs measure; scorecards communicate. A department scorecard brings the relevant KPIs together with their status, trend and owner, so leaders can see quickly where performance is on track and where action is needed. Under ISO 9001 clause 9.1.3, the results of monitoring and measurement must be analysed and evaluated, and scorecards are a practical way to do it.
Red, amber and green, defined
RAG status only works when everyone agrees what each colour means. Green typically means at or better than target. Amber means below target but within an agreed tolerance, a warning. Red means outside tolerance, requiring action. Defining thresholds per KPI, rather than applying one rule to all, reflects that a 2% miss matters more for some indicators than others.
02 · Design for decisions
What a good scorecard shows.
- Each KPI’s latest result against target.
- A red, amber or green status based on agreed thresholds.
- The trend over recent periods.
- The owner responsible for the result.
- Commentary explaining significant movements.
Fewer, well-chosen KPIs per department make a scorecard easier to act on.
How many KPIs?
There is no fixed number, but most departments struggle to give real attention to more than eight to twelve indicators. If a scorecard has thirty KPIs, many are probably operational metrics better tracked within the team. The scorecard for leadership should focus on the indicators that drive objectives and signal risk.
03 · Read the trend
Direction matters as much as status.
- A green KPI declining for three periods may need attention before it turns amber.
- A red KPI improving steadily may need patience, not intervention.
- Volatile KPIs may indicate measurement problems rather than performance problems.
Trend lines give context that a single status cannot.
Simple trend rules help reviewers spot signals consistently: several consecutive periods moving in the same direction, a sudden step change, or a result far outside the usual range. Statistical process control offers more rigorous methods for distinguishing real change from normal variation, and is worth considering for critical indicators.
04 · Freeze the snapshot
One version of the truth per review.
Before a performance review, take a frozen snapshot of the scorecard. Everyone discusses the same numbers, and the snapshot is kept as a record of what was reviewed and decided, even if data is corrected later.
Snapshots also make it easy to compare one review with the next.
They protect accountability too. If a figure is corrected after the review, the snapshot shows what decision-makers saw at the time. That matters when decisions are revisited later, or when auditors ask what management knew and when.
05 · Record actions
Reviews should change something.
Each red or concerning KPI discussed should end with an agreed action or an explicit decision to monitor. Actions need owners and due dates, and their status should be reviewed at the next session.
Common pitfalls
- Inconsistent versions: different people bringing different exports to the same meeting.
- Colour without thresholds: RAG status assigned by judgement on the day.
- Status without trend: a green KPI in steady decline that nobody notices until it turns red.
- Reviews without actions: red indicators discussed every month with no change.
06 · Certora KPI management
Scorecards, trends and frozen reviews.
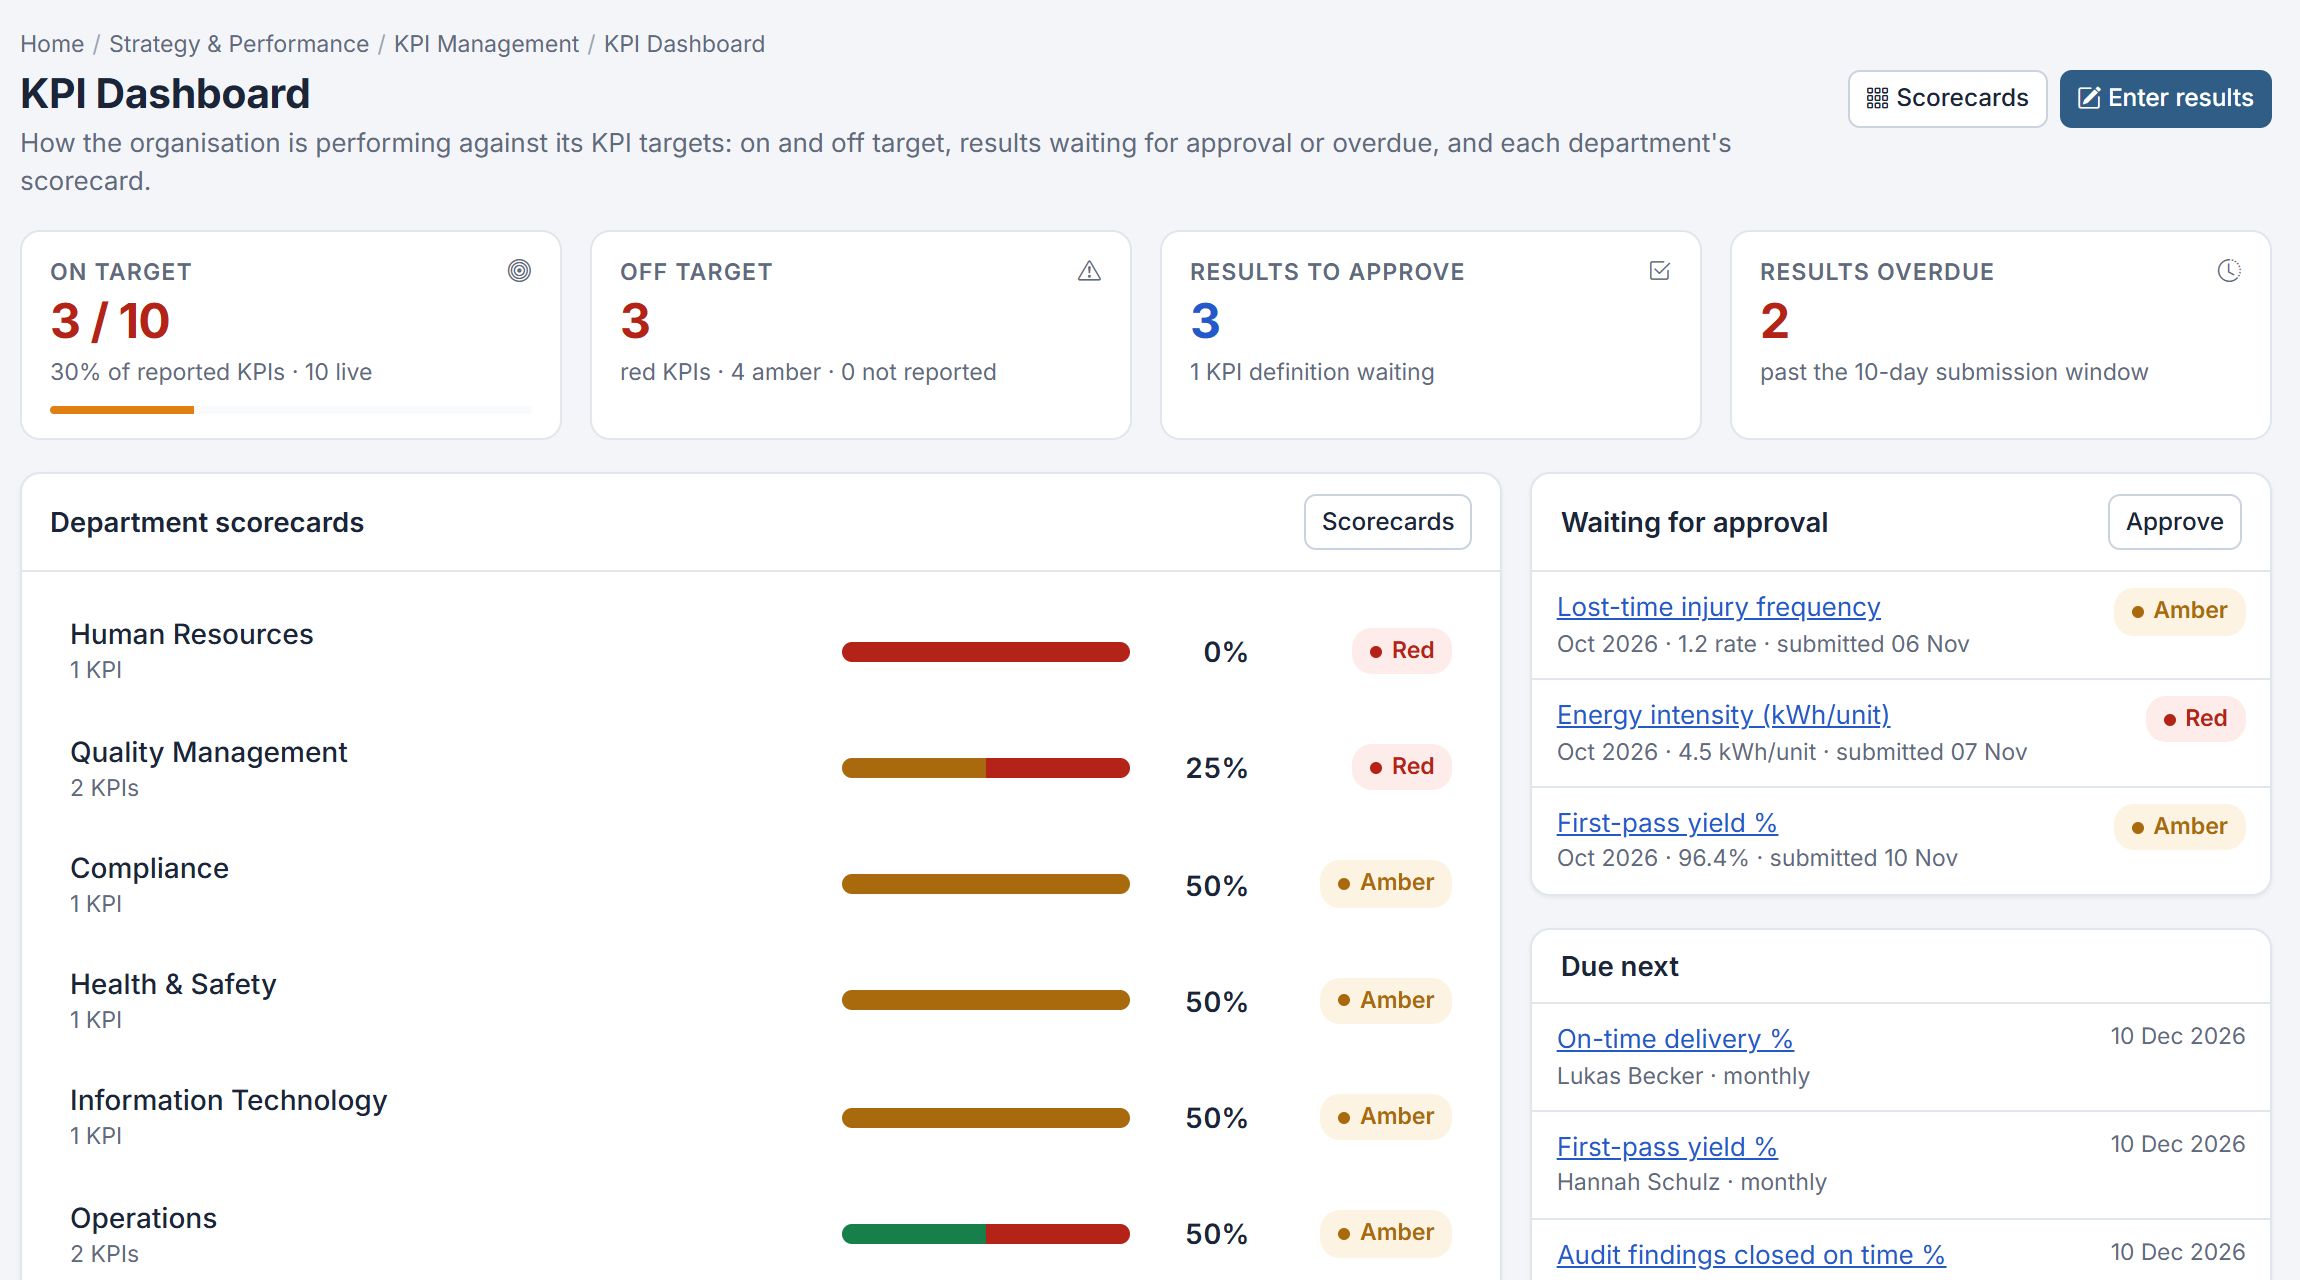
Certora KPI Management shows red, amber and green department scorecards with trends, built from KPIs with formulas, targets and thresholds and results approved each period. Performance is reviewed with frozen snapshots, and target changes keep an audit trail.
The KPI dashboard gives leadership the cross-department view, and scorecard results feed management review. See defining quality KPIs for ISO 9001 for how KPIs are set up.