ESG data you can publish starts with monthly collection and independent approval.
How to collect ESG metrics monthly with clear definitions, owners and independent approval, so sustainability data is reliable enough to publish and assure.
The principle
ESG figures collected once a year from spreadsheets are the hardest numbers in the annual report to defend.
Sustainability reports increasingly face the same scrutiny as financial reports. Yet ESG data is often gathered at year end from spreadsheets across sites and departments, with little evidence of how each figure was produced or checked.
That approach struggles under assurance. When an assurer asks how the electricity figure for a site was calculated, who checked it, and what source documents support it, a year-end spreadsheet rarely has good answers. Monthly collection with independent approval builds those answers into the process.
01 · Start with context
Data quality is the foundation of credible reporting.
Reporting frameworks such as GRI, the ISSB’s IFRS Sustainability Disclosure Standards and the European Sustainability Reporting Standards expect disclosures to be accurate, complete and verifiable. Under the CSRD, sustainability information is subject to external assurance, starting at limited assurance, and other jurisdictions are moving in similar directions.
Where external assurance is required or sought, the assurer will want to see how data was collected, by whom, how it was reviewed, and how estimates and assumptions were made.
Typical ESG metrics
Common metrics include energy consumption by source, Scope 1 and Scope 2 greenhouse gas emissions, water withdrawal, waste generated and diverted, workforce composition, training hours, safety incident rates, and governance indicators such as ethics training completion. The material topics from the double materiality assessment determine which metrics matter for your organisation.
02 · Define each metric
One definition for everyone.
- Name and unit: for example, electricity consumption in kWh.
- Scope: which sites, entities and activities are included.
- Method: the calculation, emission factors or conversion used.
- Source: meters, invoices, HR systems.
- Owner: who provides the figure each period.
Emission factors and estimates
Greenhouse gas figures depend on emission factors, which change over time and vary by source. Recording which factor was used, and its version, makes figures reproducible. Where estimates are unavoidable, such as for a site with missing invoices, the estimation method should be documented and the estimate flagged, so it can be replaced with actual data later.
03 · Collect monthly
Small, regular submissions.
- Owners enter each metric for the month.
- Supporting evidence is attached, such as invoices or meter readings.
- Values outside expected ranges are flagged for explanation.
Monthly collection spreads the work, catches errors early, and gives management a current view of performance rather than an annual surprise.
Range checks are a simple and effective control. A month where electricity use doubles, or waste drops to zero, is either a real event worth understanding or a data error worth correcting. Asking for an explanation at the point of entry resolves most anomalies before they reach the report.
04 · Approve independently
A second person checks each submission.
An approver who did not enter the data reviews each value and its evidence, then approves or returns it. Independent approval is one of the most effective controls for data quality, and it gives assurers a clear trail.
Approvers should check more than arithmetic. Does the evidence support the figure? Is the scope consistent with previous months? Has the correct emission factor been applied? A short checklist for approvers improves consistency.
05 · Report from approved data
One source for every disclosure.
Objectives, dashboards and the sustainability statement should draw from the same approved data, so figures are consistent wherever they appear. Changes after approval should be recorded with the reason.
Restatements happen, for example when an error is found in a prior year. Recording restatements with the original value, the corrected value and the reason maintains transparency, which assurers and readers both value.
Common pitfalls
- Year-end scramble: twelve months of data gathered in the final weeks before publication.
- No evidence: figures entered without invoices, readings or source reports attached.
- Self-approval: the person entering data also approving it.
- Inconsistent scope: sites added or removed between periods without explanation.
06 · Certora ESG management
Monthly metrics, independently approved.
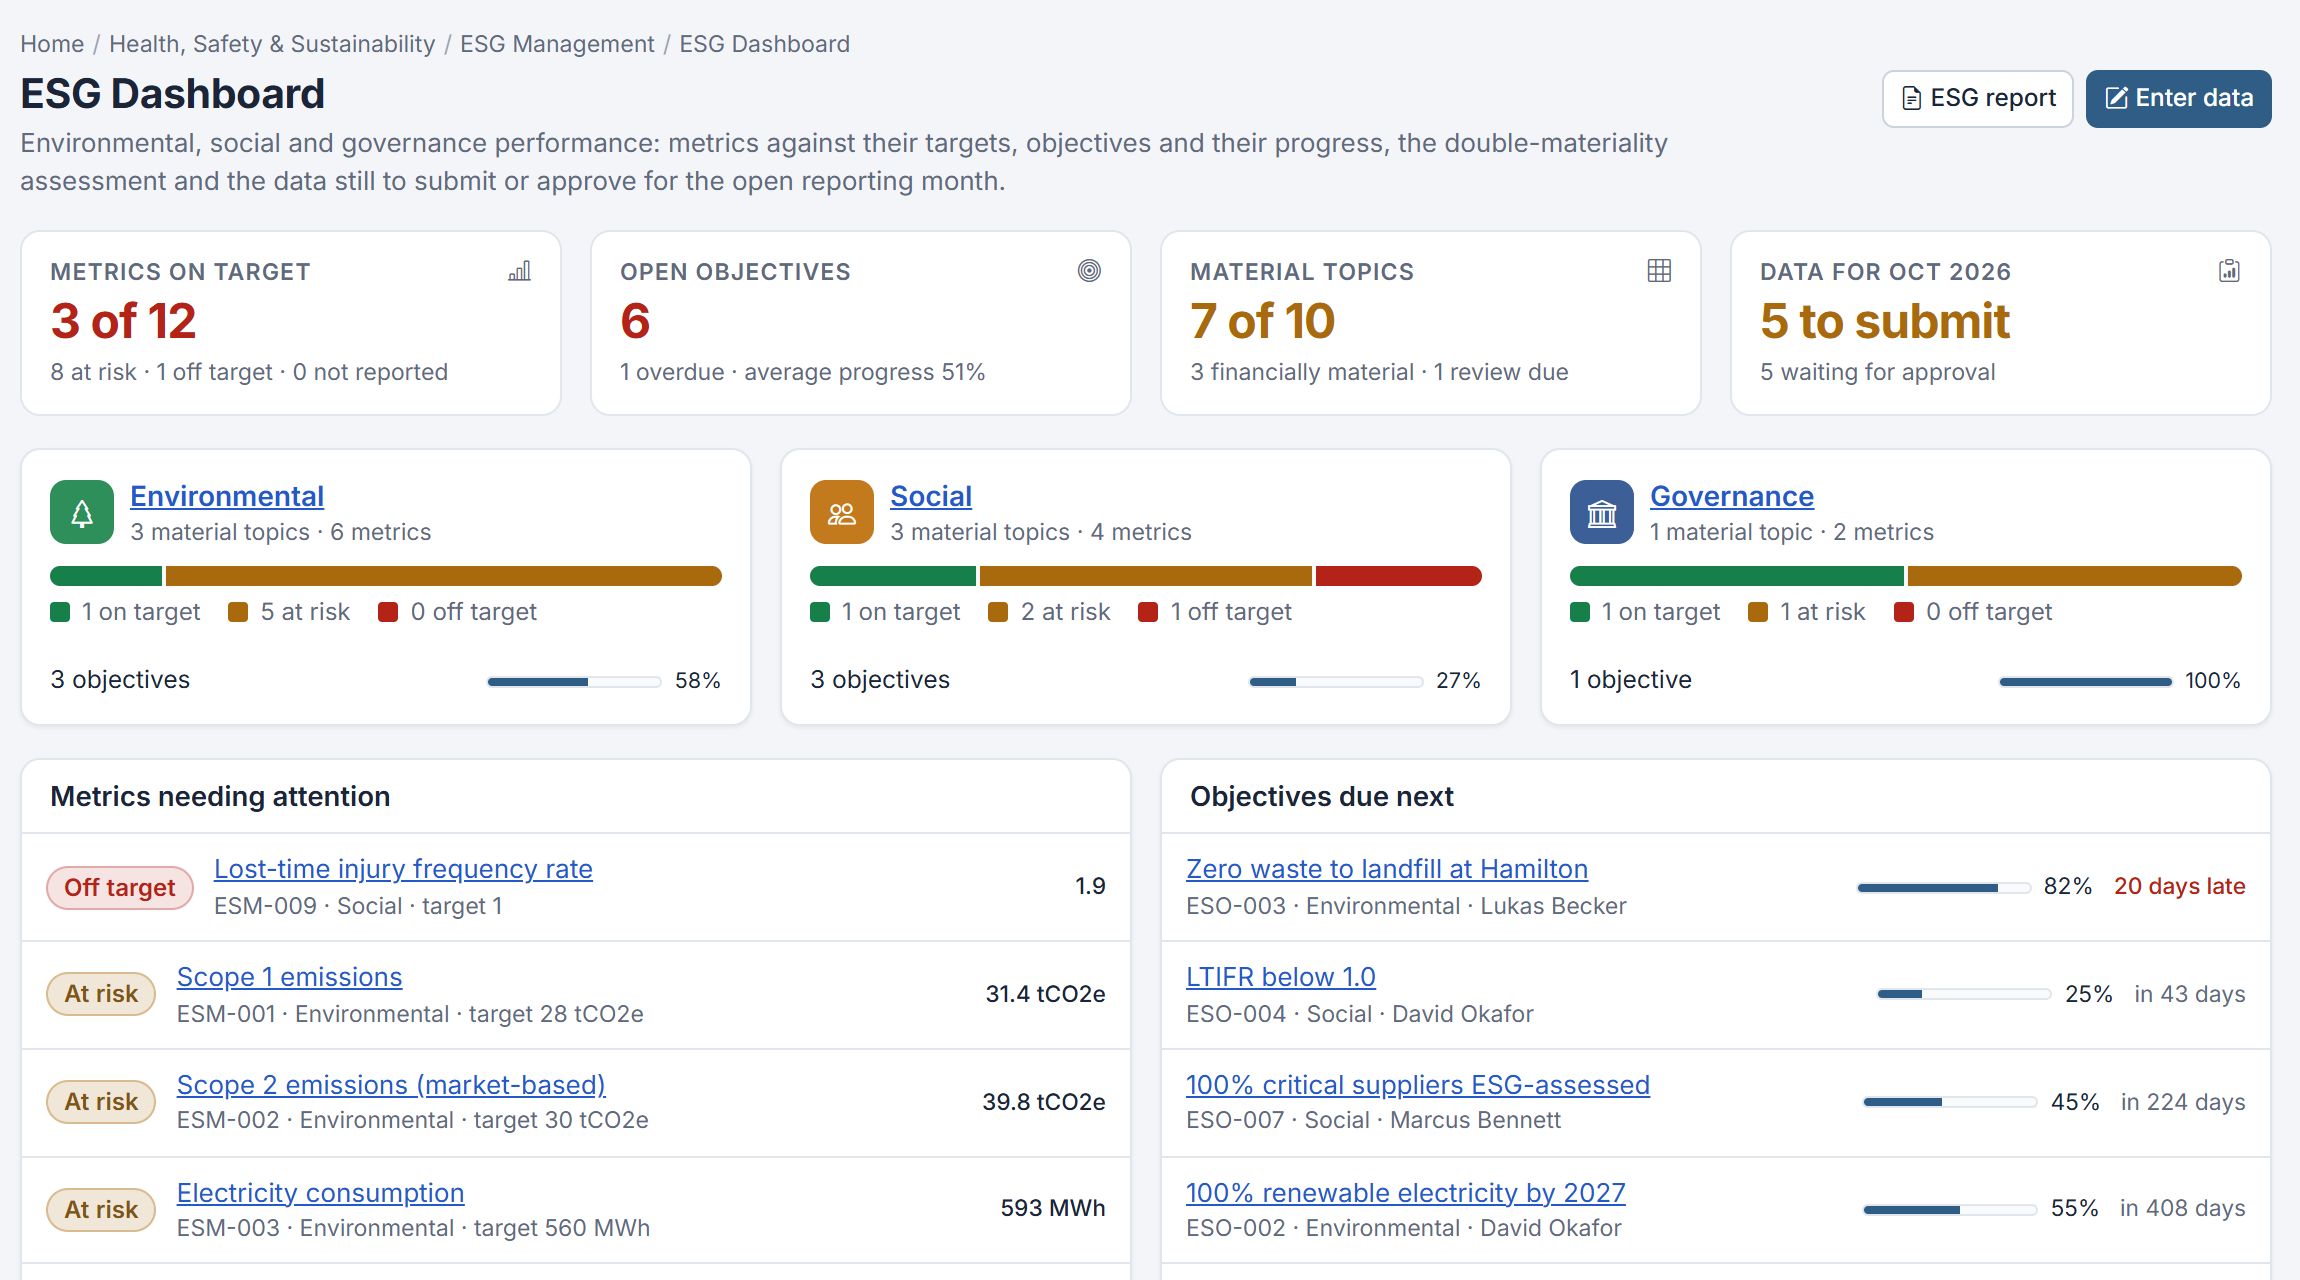
Certora ESG Management collects monthly ESG metrics with independent approval and follows environmental, social and governance performance against measurable objectives. Double materiality is assessed, and a sustainability statement is published from the approved data.
The ESG dashboard shows performance against objectives and metrics awaiting approval. See double materiality assessment for how reporting topics are chosen.