Customer satisfaction monitoring should lead to action, not just a score.
How to monitor customer satisfaction for ISO 9001 clause 9.1.2 with surveys, NPS and CSAT, account health and complaints, and turn results into improvement.
The principle
A satisfaction score is a summary. The comments and complaints behind it are where improvement starts.
Many organisations meet ISO 9001’s customer satisfaction requirement with an annual survey. The results are presented once, a few actions are agreed, and the next survey arrives with little changed. Satisfaction monitoring works best as a continuous signal.
An annual survey captures how customers felt on one day, often months after the experiences that shaped their view. By the time results arrive, the issues behind low scores may have cost you the account. Continuous monitoring catches problems while they can still be fixed.
01 · Start with context
What clause 9.1.2 requires.
ISO 9001 clause 9.1.2 asks organisations to monitor customers’ perceptions of the degree to which their needs and expectations have been fulfilled, and to determine the methods for obtaining, monitoring and reviewing this information. The standard’s note gives examples such as customer surveys, customer feedback on delivered products and services, meetings with customers, market-share analysis, compliments, warranty claims and dealer reports.
Customer satisfaction and feedback from relevant interested parties is also a required input to management review under clause 9.3.2.
Perception, not just performance
The clause asks about customer perception. Internal measures such as on-time delivery are valuable, but they are not the same thing. A delivery can be on time by your measure and still late by the customer’s, if their expectation was different. Monitoring perception directly reveals those gaps.
02 · Combine several signals
No single measure tells the whole story.
- Surveys: structured questions with ratings and comments.
- NPS: how likely customers are to recommend you.
- CSAT: satisfaction with a specific interaction or delivery.
- Complaints and feedback: unsolicited signals of problems.
- Account health: a view per customer combining the above.
Together these show both overall sentiment and where specific problems lie.
NPS and CSAT in brief
Net Promoter Score asks how likely a customer is to recommend you, on a scale of 0 to 10. Respondents scoring 9 or 10 are promoters, 0 to 6 are detractors, and the score is the percentage of promoters minus the percentage of detractors. CSAT typically asks how satisfied a customer was with a specific interaction, often on a five-point scale. NPS tracks the overall relationship; CSAT tracks individual touchpoints.
03 · Survey well
Short, timely and targeted.
- Survey after meaningful interactions, not only once a year.
- Keep surveys short enough that customers complete them.
- Include space for comments; they often matter more than the score.
- Write results back to the customer account so they inform the relationship.
Response rates matter. A survey answered by a handful of very happy or very unhappy customers gives a distorted picture. Short surveys, sent at the right moment and visibly acted on, keep response rates healthy over time.
04 · Act on the results
Close the loop with customers.
Low scores and negative comments deserve follow-up, ideally a conversation with the customer. Themes across many responses should become improvement actions with owners, tracked like any other action.
Telling customers what changed as a result of their feedback is one of the most effective ways to improve satisfaction itself.
Who follows up
Detractor follow-up works best when the person contacting the customer has the authority to address the issue, such as an account manager or a senior service lead. A generic "thank you for your feedback" email rarely changes a detractor’s view. A call that listens, explains and commits to a specific change often does.
05 · Report trends
Satisfaction over time, by segment.
Trends matter more than single results. Reporting NPS and CSAT over time, by customer segment, product or region, alongside complaint volumes and SLA performance, gives management review a meaningful picture of customer perception.
Linking satisfaction to account health helps prioritise. A detractor who is a top-ten customer deserves different attention from one who placed a single small order, and account health makes that distinction visible.
Common pitfalls
- Annual survey only: results arrive long after the experiences that drove them.
- Score without comments: numbers reported with no insight into why.
- No follow-up: detractors surveyed and never contacted.
- Satisfaction in isolation: survey results not linked to complaints, SLAs or account health.
06 · Certora customer engagement
Surveys, NPS and CSAT in one view.
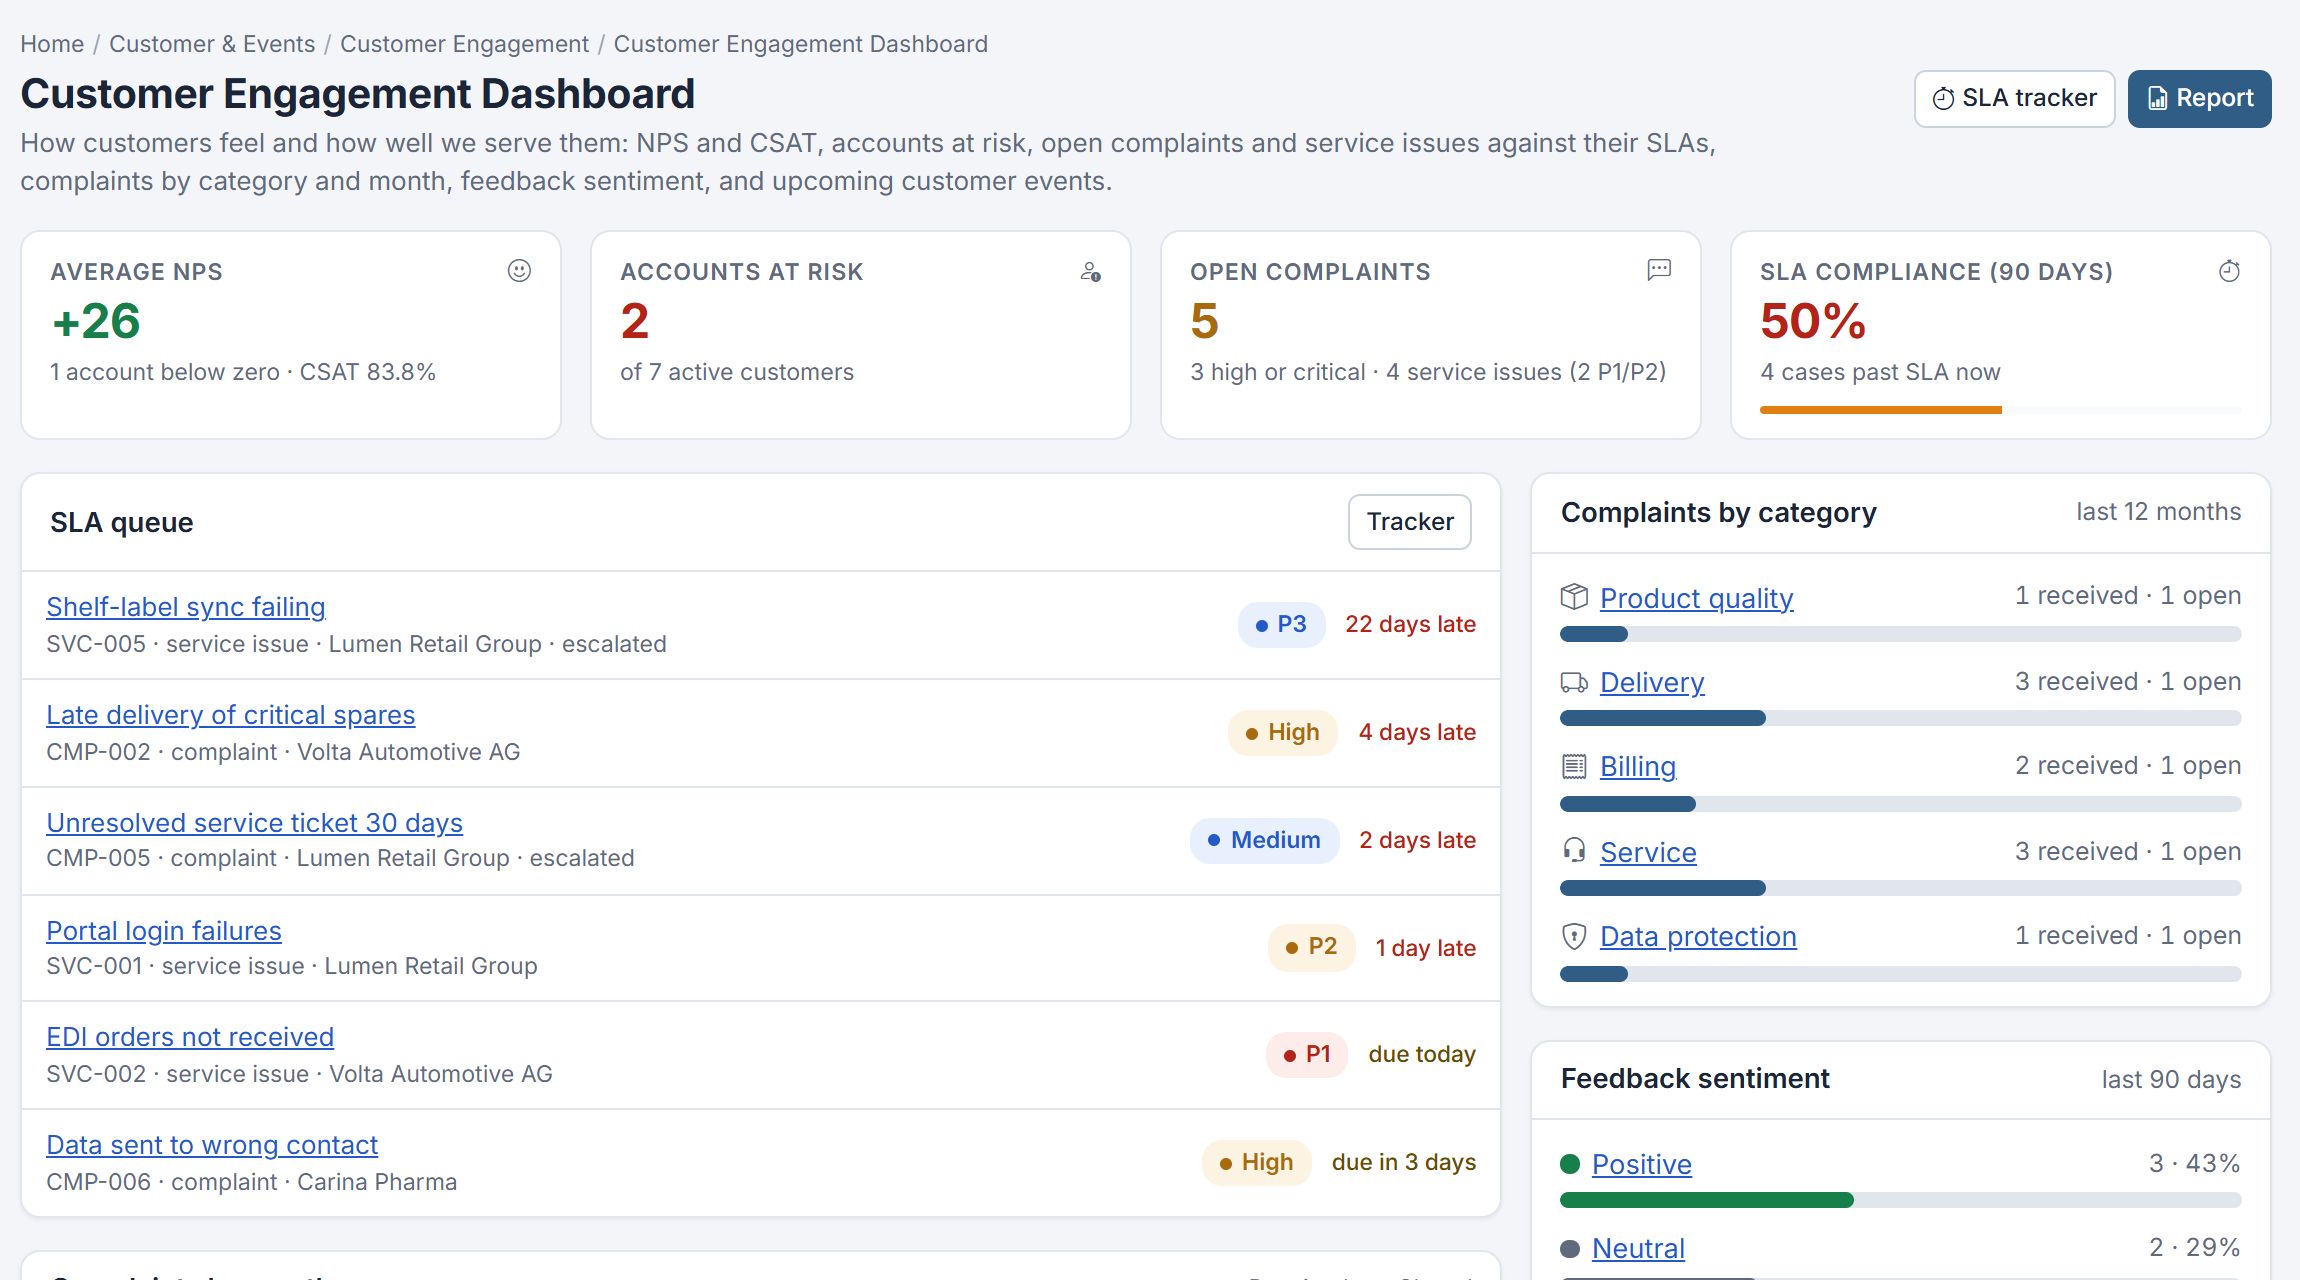
Certora Customer Engagement runs satisfaction surveys whose completion writes NPS back to the customer, alongside CSAT, feedback and complaints. Customer accounts carry SLA tiers and health, and the satisfaction report brings the results together, with CSV export.
The customer engagement dashboard shows average NPS and CSAT, accounts at risk and open complaints. See complaint handling aligned with ISO 10002 for how complaints are managed.